ActiveBlog

Komodo IDE: Code Profiling
by Todd Whiteman

Todd Whiteman, August 12, 2011

Komodo IDE - Code Profiling

For programmers, one of the most common questions posed is "Why is my application taking so long?" For dynamic programming languages, there are often limited tools that can answer this important question, or variant questions like:

  • Where is my application spending the most CPU time?
  • How many times is this function getting called?
  • By changing X to Y, what performance impact will this have?
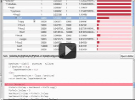
With Komodo IDE 7 (currently Alpha 4 - available at the bottom of the download page), Python programmers will now be able to answer these questions using the new Code Profiling tools. You can easily launch your application with code profiling enabled, and when the application finishes, Komodo IDE will show you a graphical representation of the code profiling results. This will allow you to easily see exactly where your program spends most of it's time, showing which functions were called and which functions called what other functions, how many times they were called and how long they took to execute.

Armed with this knowledge, you'll be able to quickly trace your applications, tweak your code and then re-run them, comparing the performance results to your previous runs.

Note: As of 7.0.0 Alpha 4, Komodo IDE's Code Profiling launcher only supports Python, though you can open standalone profiling results that are stored in the callgrind format, which is a common profiling format used in other dynamic languages.

Trackback URL for this post:

http://www.activestate.com/trackback/3128
Category: komodo
About the Author: RSS

Todd Whiteman is the Development Lead for Komodo IDE. He works adeptly with Mozilla, Python and JavaScript to ensure that Komodo IDE is the IDE of choice for development teams. Todd has been working on Komodo IDE for nearly 6 years, adding components such as the Vi Key Bindings, Distributed Source Code Control, 64-bit Linux builds as well as Remote SSH support into Komodo IDE.

SHARE THIS:

Comments

7 comments for Komodo IDE: Code Profiling
Permalink

That sounds like a really nice feature.
Are you planning PHP profiling, too?

Permalink

Yes, we are planning to add PHP Code Profiling support as well.

Note: You can already open PHP/Xdebug profile files in Komodo's code profile dialog:
http://xdebug.org/docs/profiler
though we'll be making this easier - by being able to do all this from within Komodo itself.

Cheers,
Todd

Permalink

Wow- that is absolutely awesome. I used to time every function myself simply by using the time command but you understand that it just not very handy. My favorite Perl IDE just got better.

Permalink

Um, actually, it does not seem to handle Perl profiling. I downloaded version 7 just for this, because my company uses Komodo exclusively for Perl development, and surprised to see the popup window saying that it doesn't handle Perl profiling. What gives?

Permalink

7.0 has built-in support for PHP and Python profiling only. However, you could run profiling with Devel::NYTProf, use nytprofcg to convert the output into KCachegrind format, then view it in Komodo.