Komodo IDE’s debugging facilities are quite remarkable. It has built-in debuggers for Python, Perl, Ruby, NodeJS, Tcl, JavaScript (via Google Chrome), PHP, and even XSLT. Chances are if you are using Komodo IDE to write your code, you can also use Komodo IDE to debug it.
More often than not, debugging is a simple operation:
- Identify the subroutine you know a problem is occurring in.
- Set a breakpoint within that subroutine.
- Run your code to the breakpoint.
- Inspect what is happening around the problem.
- Identify the problem and fix it.
- Rinse and repeat.
This is the usual routine for the vast majority of debug instances, and Komodo IDE provides everything you need to accomplish these tasks. However, where Komodo IDE really excels is in its advanced debugging features. Did you know that you can set conditional breakpoints? How about running arbitrary code to inspect the current environment at a breakpoint? Keeping watch over the values of entire expressions (not just single variables)? Komodo IDE can do all of this and more. This blog post will illustrate some of Komodo’s advanced debugging capabilities.
The Basics
As a refresher, debugging code in Komodo is very straightforward:
- Open the file you want to debug.
- Set a breakpoint by clicking the left-most margin in the editor next to the line of code to set a breakpoint on. (Or navigate to the line to break on and select the “Debug > Disable/Enable/Delete Breakpoint” menu or press the F4 key.)
- Click the “Play” button in the toolbar to begin debugging. (Or select the “Debug > Go” menu or press the F5 key.)
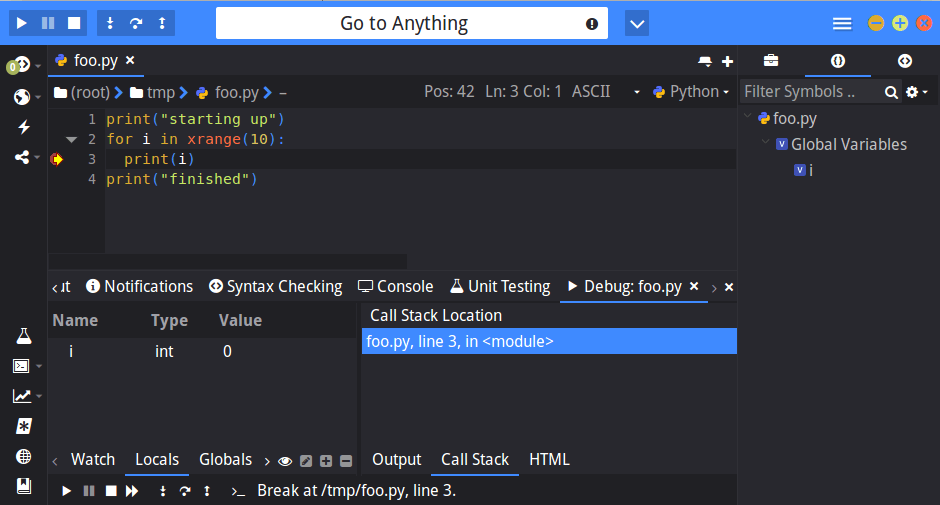
- Komodo IDE is now debugging your code. The image below shows what Komodo looks like during a typical debugging session.
Advanced Debugging
Let us consider the Python code being debugged in the previous image:
print("starting up")
for i in xrange(10):
  print(i)
print("finished")
I have put a breakpoint within the loop, and the debugger breaks upon the first iteration of the loop. Suppose I really only wanted to break starting on the 5th iteration of the loop, when the value of i is 4. I do not have to restart my debug session. All I have to do is replace the current breakpoint with a conditional breakpoint and continue debugging.
Conditional breakpoints function exactly how they sound: the debugger breaks on a line only when a particular condition is satisfied. Komodo allows you to set conditions for breakpoints in the “Breakpoints” tab in the bottom pane:
- Select the breakpoint to replace with a conditional breakpoint.
- Click “Delete breakpoint”.
- Click “New”, and then click on the “Conditional” tab.
- Enter the condition to break on.
- Click “Ok”.
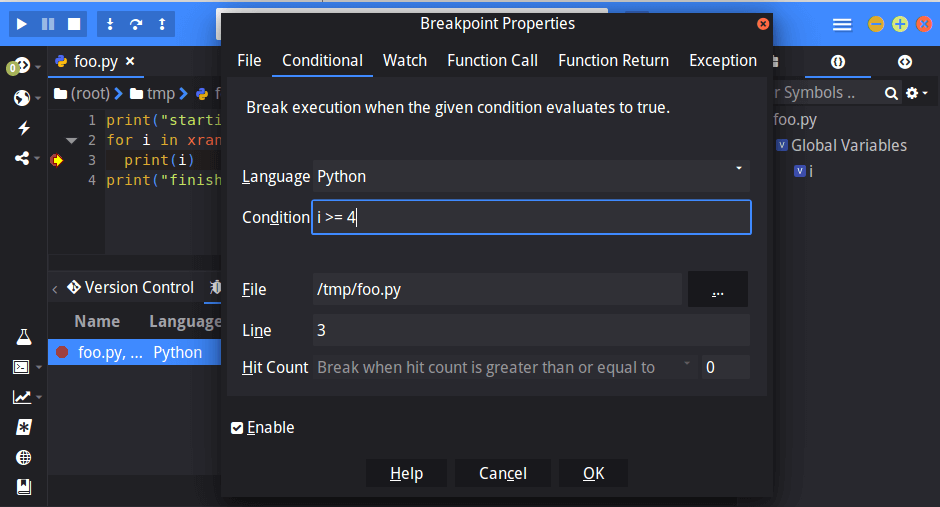
Now pressing the “Play” button resumes execution until i is 4.
Note that you can create different kinds of advanced breakpoints using the dialog, such as breakpoints when the value of a variable or expression changes, when a function is called or returns, when an exception happens, and so on. Each language supports its own set of breakpoint types.
So at this point in our debug session, i has the value 4. Suppose I wanted to inspect the current Python environment by running arbitrary statements, or perhaps just play around with the value i. I can do this with the “Debug > Inspect” menu. (Or by clicking the “>_” icon in at the bottom of the “Debug” tab in the bottom pane.)
Komodo IDE lets me know the debugger is paused while in inspection mode.
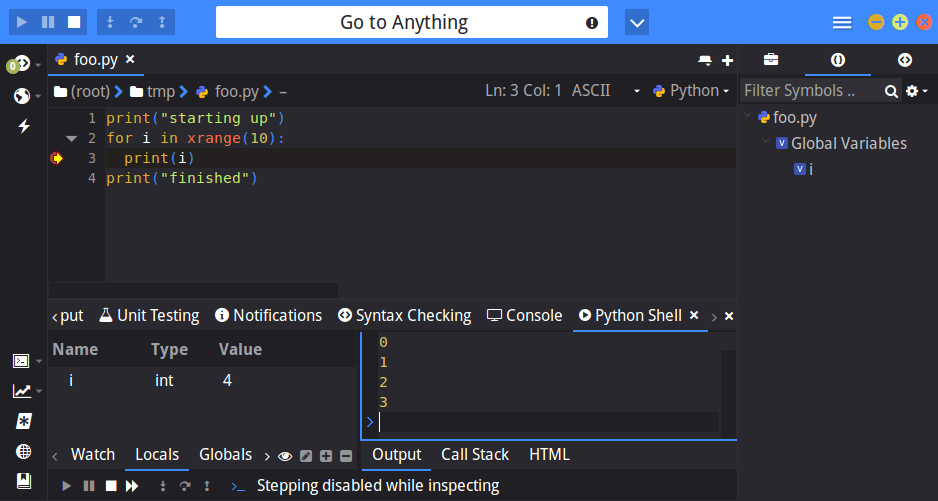
I am now free to enter arbitrary expressions into the text box, such as computing the square of i.

This is a trivial example, but you can use this powerful feature to great effect during a debugging session. Do not forget to toggle back out of inspection mode when you are finished in order to continue stepping through your code. (“Debug > Inspect”.)
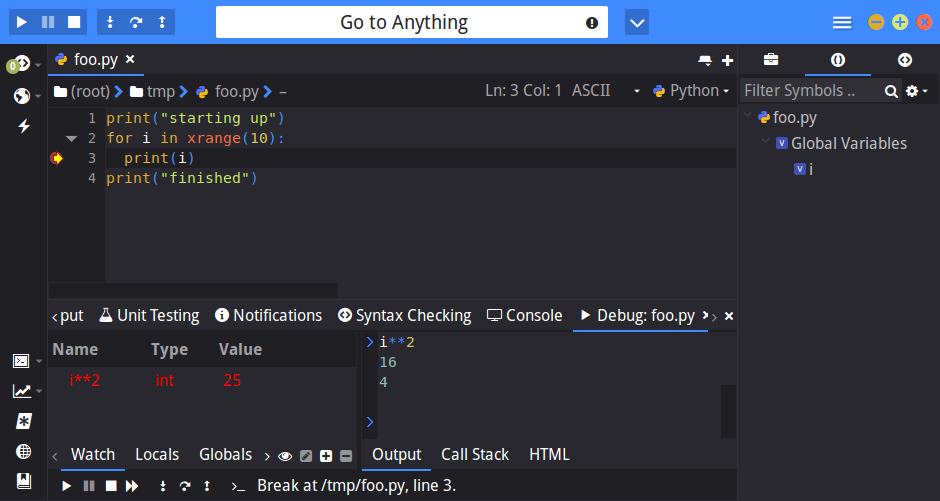
Speaking of expressions, Komodo IDE lets you monitor the values of arbitrary expressions in addition to monitoring the values of individual variables. On the left side of the debug pane, Komodo shows a list of known variables and their respective values. There are tabs to toggle the view between local variables, global variables, and more. The “Watch” tab is where arbitrary expression values can be monitored. By selecting the “Watch” tab and clicking on the “Add new variable to the watch list”, you can watch variables and expressions. Entering i**2 yields the screenshot below:
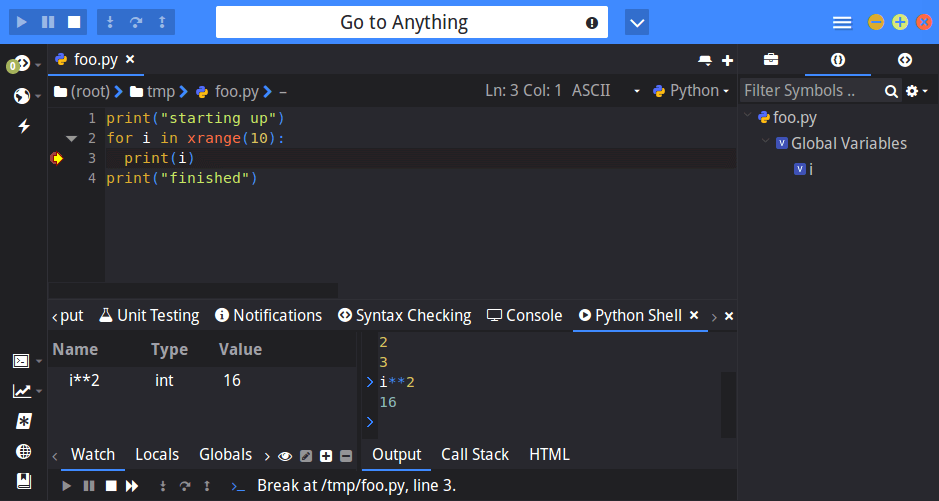
We can now monitor how the square of i changes upon each loop iteration, just like monitoring how local and global variables change over time in their respective views.
Conclusion
So that was a brief overview of some of Komodo IDE’s more advanced debugging features: conditional breakpoints, inspection, and watch expressions. These extra tools provide developers with more firepower to get their jobs done when it comes to debugging and understanding complex code.
Learn more about Komodo’s debugging facilities for all of its languages here: http://docs.komodoide.com/Manual/debugger.