
Since its release in 2015 by the Google Brain team, TensorFlow has been a driving force in conversations centered on artificial intelligence, machine learning, and predictive analytics. With its flexible architecture, TensorFlow provides numerical computation capacity with incredible parallelism that is appealing to both small and large businesses.
TensorFlow, being built on stateful dataflow graphs across multiple systems, allows for parallel processing—data to be leveraged in a meaningful way without requiring petabytes of data. To demonstrate how you can take advantage of TensorFlow without having huge silos of data on hand, I’ll explain how to use TensorFlow to build a linear regression model in this post.
Linear Regression Overview
Linear modeling is a relatively simplistic type of mathematical method that, when used properly, can help predict modeled behavior. It does this by allowing you to create a model based on values in a data set, then use that model to predict other values that are not part of your set.
In mathematical terms, linear regression is a method of determining coefficients of a linear combination of variables:
y = a_0 x_0 + a_1 x_1 + … + a_n x_n
Linear regression requires that the relationships between the quantities be linear, not the variables themselves. So we could, for example, fit a target variable y to a polynomial:
y = a_0 + a_1 x + a_2 x²
In this case, we will have to supply both x and x^2 for every data point. For example, the trajectory of a meteor thrown through the sky forms a parabola with equation d = d_0 + v t + 0.5 a t^2, where d is the distance travelled, v is the velocity, and a is the acceleration due to gravity (9.8 m / s^2 on the surface of Earth). We could determine the coefficients v and a from a set of data using linear regression. We could utilize the same practice to determine projected inventory based on sales, or expected patrons on any given night at a movie theatre.
Deep dive into Machine Learning with Tensorflow in this on-demand webinar
TensorFlow Application
So now, let’s take a look at where TensorFlow can help us. Let’s presume we have a data set built on movie attendance throughout the course of a year.
We can utilize placeholders in TensorFlow to set our variables—these will need to be filled in upon execution.
X = tf.placeholder(tf.float32)
Y = tf.placeholder(tf.float32)
We will set our weight and bias, as well as a predict variable. TensorFlow utilizes the “Variable” constructor for this, which can ultimately be a “Tensor” of any type.
The loss function will measure the distance between our observations and predictions over the course of time:
loss = tf.reduce_sum(tf.pow(Y_pred - Y, 2)) / (n_observations - 1)
TensorFlow defines the Optimizer as a method “to compute gradients for a loss and apply gradients to variables.” The GradientDescentOptimizer (see the documentation here) was utilized in this code example:
optimizer = tf.train.GradientDescentOptimizer(learning_rate).minimize(loss)
We can create a session and tell TensorFlow to initialize all of our variables in the graph:
n_epochs = 1000
with tf.Session() as sess:
    # Here we tell tensorflow that we want to initialize all
    # the variables in the graph so we can use them
    sess.run(tf.initialize_all_variables())
Lastly, we want to fit the training data in order to produce results:
with tf.Session() as sess:
    # Here we tell tensorflow that we want to initialize all
    # the variables in the graph so we can use them
    sess.run(tf.initialize_all_variables())
	    # Fit all training data
    prev_training_loss = 0.0
    for epoch_i in range(n_epochs):
        for (x, y) in zip(xs, ys):
            sess.run(optimizer, feed_dict={X: x, Y: y})
			        training_loss = sess.run(
            loss, feed_dict={X: xs, Y: ys})
        print(training_loss)
		        if epoch_i % 20 == 0:
            ax.plot(xs, Y_pred.eval(
                feed_dict={X: xs}, session=sess),
                    'k', alpha=epoch_i / n_epochs)
            fig.show()
            plt.draw()
			        # Allow the training to quit if we've reached a minimum
        if np.abs(prev_training_loss - training_loss) < 0.000001:
            break
        prev_training_loss = training_loss
A simple show() command in Python will show our results graphically:
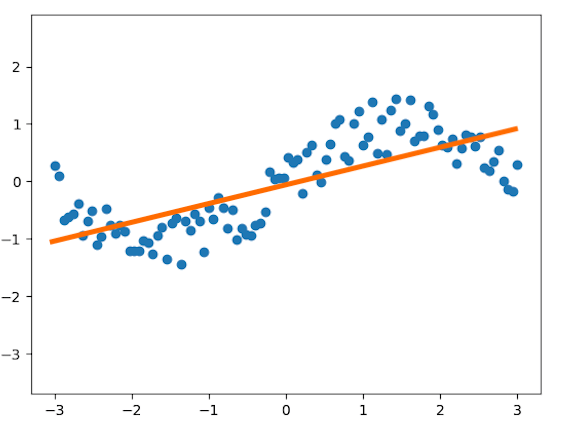
The through line shows us the linear regression (our prediction) of movie attendees throughout the year. Data such as this could help managers determine how to staff their theatre throughout the year, with relative certainty.
Conclusion
TensorFlow is an incredibly agile tool that will continue to drive forward advancement in machine learning and artificial intelligence. However, practical application in predictive analytics is easily achieved with some basic knowledge of Python and statistics. Utilizing the processing power of a tool like TensorFlow in combination with the data at your disposal can lead to some very insightful business applications that will alter the state of decision-making in your company. That, combined with TensorFlow’s scalability and ability to run on systems like Android, will make your insights more applicable and accessible to a diverse user base.
For more information on TensorFlow and regression modeling, see the following:
- https://www.tensorflow.org/tutorials/linear
- https://www.tensorflow.org/tutorials/wide
- https://www.tensorflow.org/tutorials/wide_and_deep
Deep dive into Machine Learning with Tensorflow in this on-demand webinar
Image source: @jakehills via Unsplash care of Creative Commons (CC0) license.