ActiveState Curated Catalog
Your Private Source for Vetted Open Source
Security and Engineering set the guardrails. Developers and AI coding agents consume through pip, npm, and the package managers they already use. Everyone moves faster.
.webp)
Scanners find problems after the fact
Vulnerability scanners tell you what's already in your code.
Our Curated Catalog ensures only secure, approved components are available in the first place.
ActiveState handles remediation for you
When an upstream fix is released, ActiveState rebuilds and publishes it to your catalog automatically. No manual patching, no version chasing. Industry average for Critical CVE remediation is 54 days. ActiveState's SLA is 5 business days.
AI code generators stay on rails
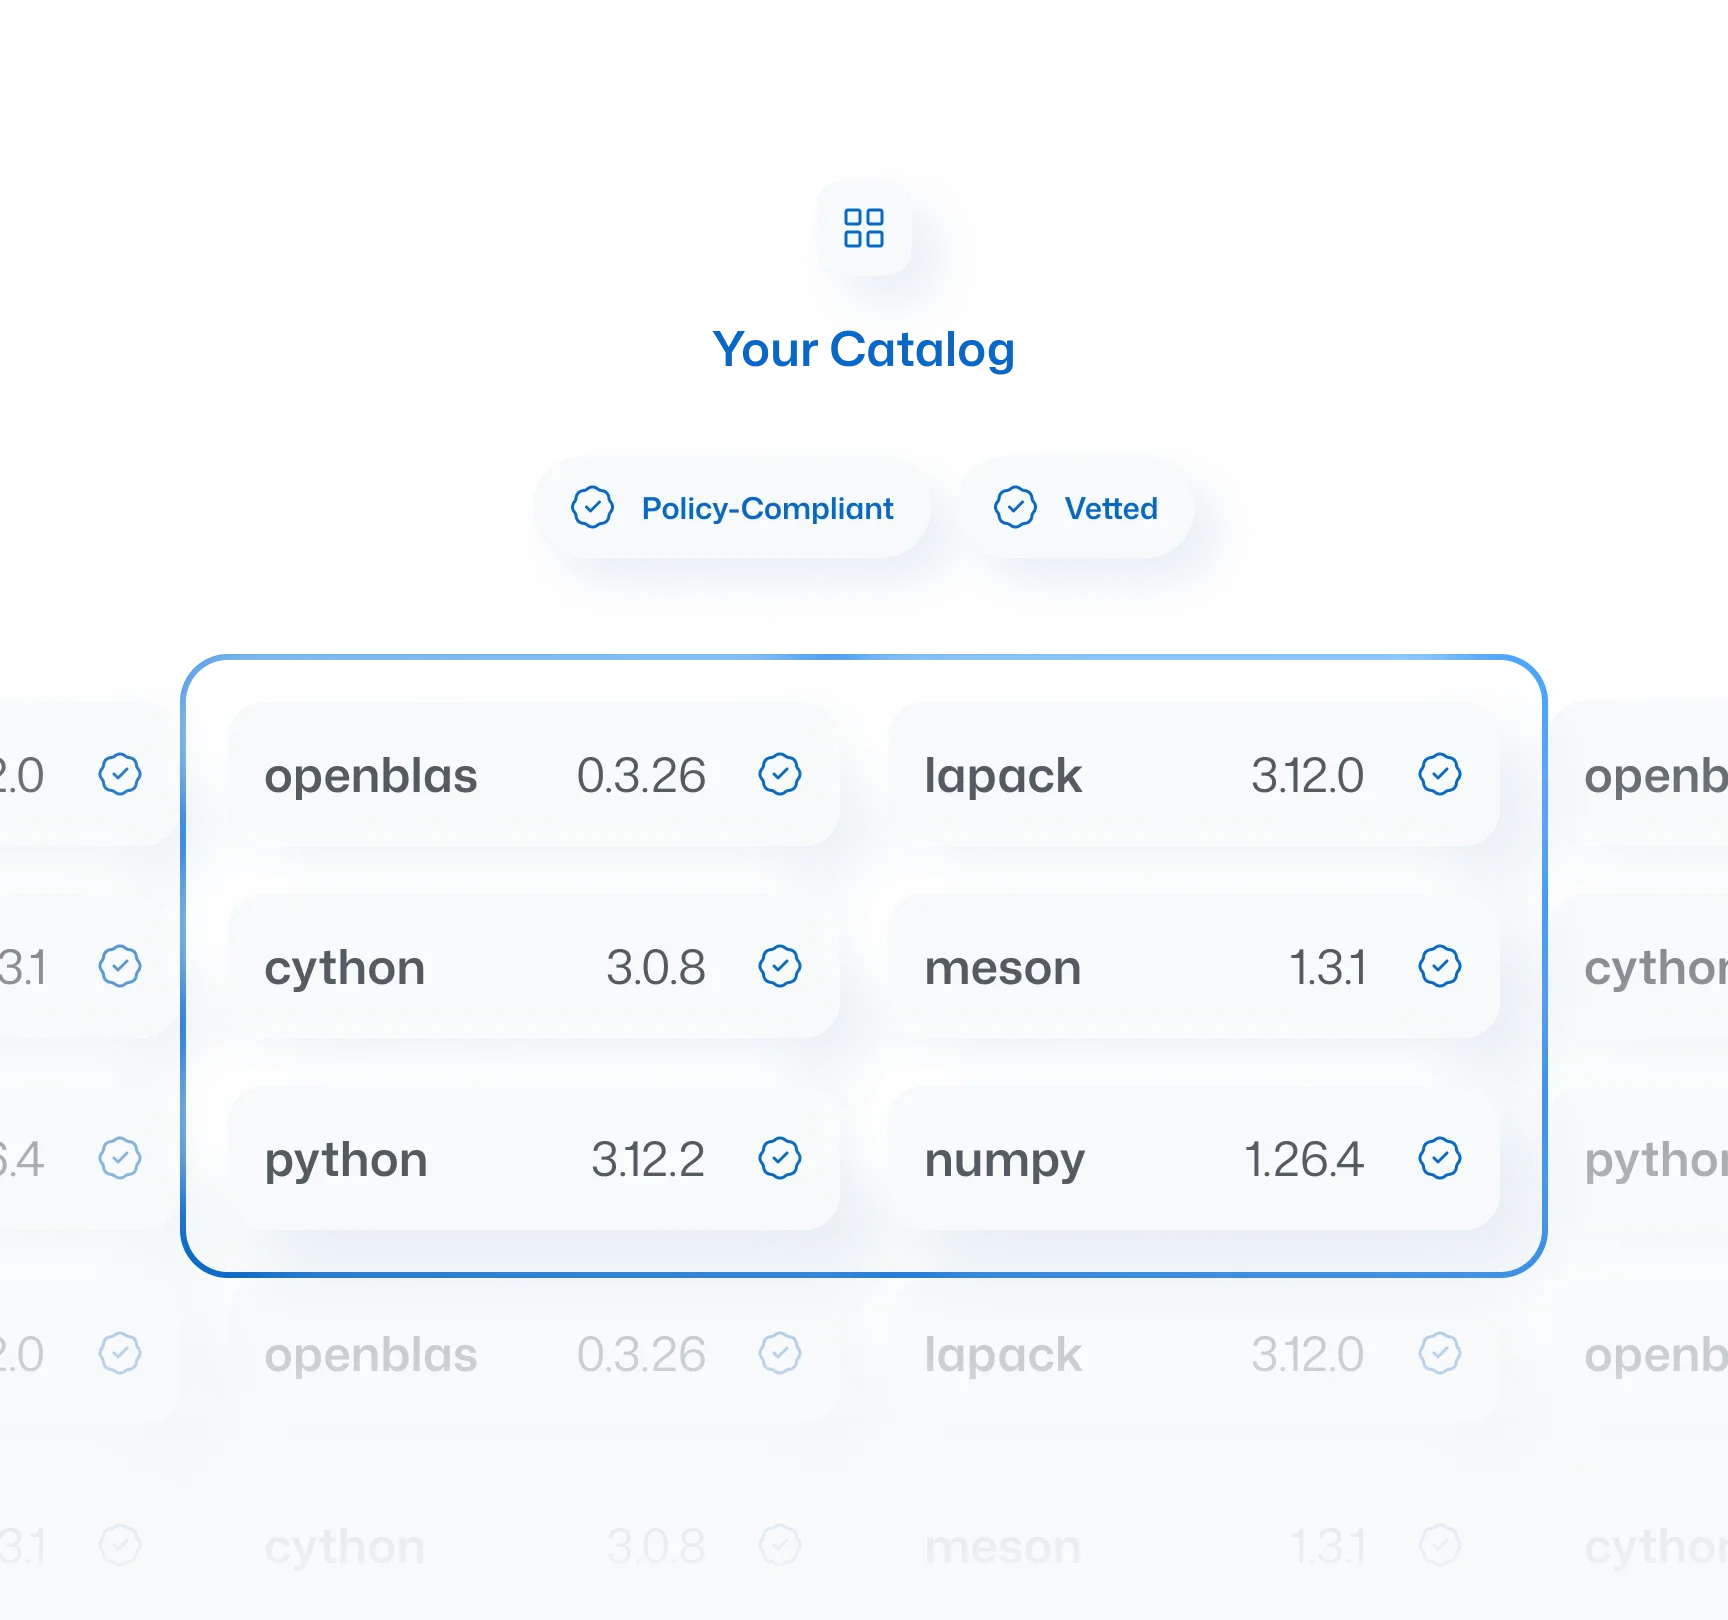
Point your AI coding assistants to the Curated Catalog and they pull only from vetted, policy-compliant packages. No rogue dependencies, no hallucinated packages that become attack vectors.
%20(1).webp)
.webp)
Developers keep their existing tools
Packages are delivered as native artifacts like Python Wheels and Java JARs. Your team installs from the Curated Catalog the same way they install from PyPI or Maven. No new CLI. No workflow changes.
Works natively with JFrog Artifactory, Sonatype Nexus, and AWS CodeArtifact
Compatible with GitHub Packages, GitLab Package Registry, Azure Artifacts, and more
Supports 9 language ecosystems including Python, Java, JavaScript, and R
Every component gets a daily security check
Our component-level security feed updates every 24 hours. When a patch drops or a new vulnerability surfaces, you know immediately.
Built from source
Every package is built from original source code using SLSA Level 3 infrastructure, with cryptographic attestation on every artifact. Full provenance, verified integrity, always up to date.
~95%
reduction in CVEs compared to public registries
Up to 30%
of developer time reclaimed from manual remediation
25+ years
of open source build expertise
FAQs
How does a Curated Catalog work with my existing tools?
It acts as a trusted upstream source for your artifact repository. Developers pull from the catalog instead of public registries. AI coding assistants can also be pointed to it, keeping AI coding on rails.
Will a Curated Catalog slow down my developers?
No, the opposite. Components are pre-vetted, so developers skip security approvals and CVE cleanup. Same workflow, secure by default.
What languages are supported?
ActiveState supports 12 languages, including Python, Java, Javascript and more.
How quickly does ActiveState remediate vulnerabilities?
5 business days for Critical CVEs, 10 for Highs, provided a fix is available upstream. Compare this to an industry average of over 54 days. Components are automatically rebuilt and published.
What does "built from source" actually mean?
ActiveState compiles every component from original source code in a SLSA Level 3 environment, rather than distributing pre-compiled binaries. This provides full transparency and tamper-proof integrity.
Still have questions?
Talk to our team.
Trust what's in your open source before it ships
Book a walkthrough. We'll show you how an ActiveState Curated Catalog fits your stack and your security requirements.
%20(1).webp)