Machine learning is often held out as a magical solution to hard problems that will absolve us mere humans from ever having to actually learn anything. But in reality, for data scientists and machine learning engineers, there are a lot of problems that are much more difficult to deal with than simple object recognition in images, or playing board games with finite rule sets.
For these majority of problems, it pays to have a variety of approaches to help you reduce the noise and anomalies, to focus on something more tractable. One approach is to design more robust algorithms where the testing error is consistent with the training error, or the performance is stable after adding noise to the dataset1.
The idea of any traditional (non-Bayesian) statistical test is the same: we compute a number (called a “statistic”) from the data, and use the known distribution of that number to answer the question, “What are the odds of this happening by chance?” That number is the p-value.
The problem with this approach is the “known distribution” of that number depends on the distribution of the data. This dependency can be mild–as in the case of Student’s t-test or the F-test–or it can be so severe as to make the value essentially meaningless for statistical purposes. Pearson’s “r” (which appears as r-squared in linear regression problems) falls into the latter category, as it is so sensitive to the underlying distributions of data that it cannot in most practical cases be turned into a meaningful p-value, and is therefore almost useless even by the fairly relaxed standards of traditional statistical analysis. For example, using r as a measure of similarity in the registration of low contrast image can produce cases where “close to unity” means 0.998 and “far from unity” means 0.98, and no way to compute a p-value due to the extremely non-Gaussian distributions of pixel values involved.
Statistics of this kind are sometimes called “parametric” statistics due to their dependency on the parameters of the underlying distributions. Student’s t-test, for example, depends in the distributions being compared having the same variance.
Robust statistics are also called “non-parametric”, precisely because the underlying data can have almost any distribution and they will still produce a number that can be associated with a p-value.
The trick is to find a property of the data that does not depend on the details of the underlying distribution. In particular, converting cardinal data value to ordinals (ranks) allows us to ask some very robust questions.
Take, for example, the Mann-Whitney U test. This is also called the Wilcoxon U test, although in keeping with Boyer’s Law (mathematical theorems are not usually named after the people who created them) it was actually first written down by Gustav Deuchler thirty years before Mann, Whitney, or Wilcoxon came on the scene.
Regardless of who created it, the test statistic (U) for a two-class problem is the sum of the ranks for one class minus a correction factor for the expected value in the case of identical distributions. The value of U is (approximately) normally distributed independently of the underlying distributions of the data, and this is what gives robust or non-parametric statistics their power.
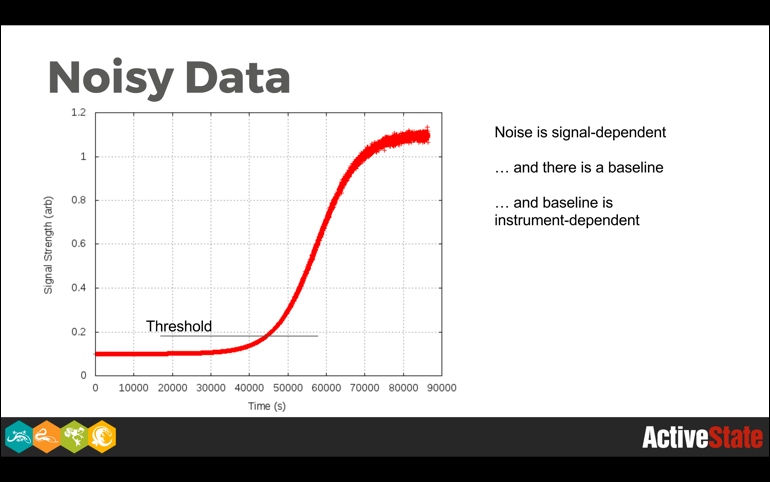
In an imaginary world quite different from this one, none of this would matter very much because data would be well-behaved. In the world we actually inhabit, this matters a great deal because of noise, outliers, and anomalies.
Even in cases where we have theoretically well-behaved data, such as is seen in fields like nuclear spectroscopy, where the law of large numbers promises to give us perfectly gaussian peak shapes, there are background events, detector non-linearities, and just plain weirdness that interferes with things.
Robust algorithms throw away information, and in the real world they frequently throw away as much or more noise as signal. So while losing signal information can reduce the statistical power of a method, degrading gracefully in the presence of noise is an extremely nice feature to have, particularly when it comes time to deploy a method into production.
In learning systems we can utilize the principle of robustness even in cases where we aren’t interested in a pure statistical analysis. Feeding robust estimators into our deep learners can protect them from irrelevant and potentially misleading information. Most learners want floating point numbers between 0 and 1 or -1 and +1 as inputs, so for ranked data it may be necessary to renormalize to a more learner-friendly scale.
It can also be tricky to use robust inputs because they can be quite coarse in their distribution of values, in the worst case consisting of a relatively small number of integer values. It would be interesting to see work done on learning systems that are optimized for this kind of input rather than the quasi-continuous values that our learners tend to be set up for today. Training becomes difficult for such coarse data because they effectively turn the smooth gradients we are trying to descend down into terraced hillsides where nothing much happens until the input steps over an embankment and plunges violently to the next level.
For all their limitations, robust approaches are a valuable addition to the data scientist’s methods, and should be considered whenever noise and anomalies are causing trouble with more traditional tools.
These are some of the Python packages that can help:
- SciPy for statistics
- Keras for machine learning
- Pandas for ETL and other data analytics
- Jupyter Notebooks for interactive/exploratory analysis
All of these are included with ActivePython. Download ActivePython Community Edition today to try your hand at designing more robust algorithms.
And check out my slides on this talk from PyData Seattle here:
1 From Robust Machine Learning: https://en.wikipedia.org/wiki/Robustness_(computer_science)