Before we start: This Python tutorial is a part of our series of Python Package tutorials. You can find other Matplotlib related topics too!
Pyplot is an API (Application Programming Interface) for Python’s matplotlib that effectively makes matplotlib a viable open source alternative to MATLAB. Matplotlib is a library for data visualization, typically in the form of plots, graphs and charts.
Pyplot API Structure
Pyplot provides matplotlib with two key features:
- A MATLAB-style interface, which allows those familiar with MATLAB to adopt Python more easily
- Statefulness, which means that pyplot stores the state of an object when you first plot it. This is essential for use in the same loop or session state until plt.close() is encountered in the code. State can also be important when creating several plots continuously.
The pyplot API consists of a hierarchy of Python code objects, and includes numerous functions topped by matplotlib.pyplot. This stack can be viewed as having three interdependent layers:
- Scripting layer – used to define a figure, which contains one or more plots, which consist of axes (i.e., x axis ,y axis, and possibly z axis)
- Artist Layer – used to manipulate elements of a plot, such as adding labels, drawing lines, etc
- Backend Layer – used to format the plot for display in a specific target application, such as a Jupyter Notebook
Scripting Layer
The top-level object in the scripting layer is matplotlib.pyplot.figure(), otherwise known as the Figure. The figure acts as a container that manages all of the elements in a given plot.
Let’s examine each line in the following script to see how pyplot creates a plot and displays it:
import matplotlib.pyplot as plt
plt.plot([1, 2, 3])
plt.title(”Simple Plot”)
plt.show()
- Imports pyplot() as plt. A configuration file is parsed and a default Figure and Axe are defined.
- The pyplot plot() command is directed to the matplotlib.axes.Axes.plot function in the backend layer. It provides a unified interface for different types of plots. In this instance, a custom Figure and Axes have not been defined, and plotting will take place in the default Figure and Axes. Pyplot assumes that [1, 2, 3] is a sequence of y values, and automatically generates a corresponding sequence of x values. The x,y values are plotted as coordinates identified as xaxis()and yaxis() function objects contained in the Axes, which is contained by the Figure. Note that a Figure can contain more than one Axes.
- The pyplot title() command is directed to the Axes.set_title function in the backend layer. This will ensure that the plot is titled “Simple Plot” in this case.
- The pyplot show() command is directed to the matplotlib.figure.Figure.show() function in the backend layer. It causes the Figure to render based on previous commands in the script, start the UI mainloop, and display the Figure and its elements on the screen.
Artist Layer
The artist layer acts as a descriptive medium between pyplot scripts and more complex Python class objects in the other layers. In this layer, abstract interface classes mediate with high level pyplot elements in the scriptinging layer, represented here as figurative objects in a drawing.
Artist is analogous to a canvas where scripts in the scripting layer correspond to classes in the backend layer, and is understood as a hierarchy of objects on an abstract canvas. It is here that a sequence of values in a pyplot script can be sketched as a line (Line2D), for example.
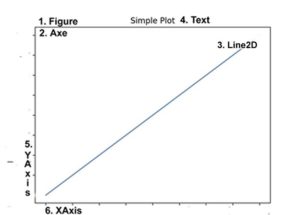
Figure 1. A sketch of artist layer elements that represent pyplot elements in the example, ‘Simple Plot’:
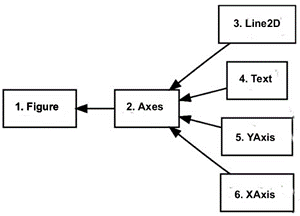
Figure 2. Hierarchy of Artist elements in the example, ‘Simple Plot’:
Backend Layer
The backend layer provides a concrete implementation of the artist layer and its abstraction. The term ‘backend’ is most commonly used to refer to output formats that matplotlib supports.
Currently supported backends include:
- matplotlib.backends.backend_mixed
- Backend that implements a renderer that switches between vector and raster drawing.
- matplotlib.backends.backend_template
- A do-nothing backend intended as a template for backend developers.
- matplotlib.backends.backend_agg
- Backend writes to file, not used for rendering.
- matplotlib.backends.backend_cairo
- Backend for raster and vector graphics. Uses the Cairo graphics library.
- matplotlib.backends.backend_gtk3agg
- Backend for Agg rendering to a GTK 3.x canvas
- matplotlib.backends.backend_gtk3cairo
- Backend for Cairo rendering to a GTK 3.x canvas.
- matplotlib.backends.backend_nbagg
- Backend that provides interactive figures for the IPython notebook.
- matplotlib.backends.backend_pdf
- Backend that provides vector graphics in PDF format.
- matplotlib.backends.backend_pgf
- Backend that converts a pdf file to a png file.
- matplotlib.backends.backend_ps
- Backend that produces both PostScript (.ps) and Encapsulated PostScript (.eps) output.
- matplotlib.backends.backend_qt4agg
- Backend for Agg rendering to a Qt4 canvas
- matplotlib.backends.backend_qt4cairo
- Backend for Cairo rendering to a Qt4 canvas.
- matplotlib.backends.backend_qt5ag
- Backend for Agg rendering in a Qt5 canvas.
- matplotlib.backends.backend_qt5cairo
- Backend for Cairo rendering in a Qt5 canvas.
- matplotlib.backends.backend_svg
- Backend that outputs plot as a Scalable Vector Graphic (SVG).
- matplotlib.backends.backend_tkagg
- Backend for Agg rendering to a Tk canvas (requires TkInter).
- matplotlib.backends.backend_webagg
- Backend that starts a tornado server with an interactive Figure, when the show() command in a script is reached.
- Matplotlib.backends.backend_wxagg
- A wxPython backend for Agg.
The following tutorials will provide you with step-by-step instructions on how to work with Matplotlib, including:
Why use ActiveState Python for Data Science
While the open source distribution of Python may be satisfactory for an individual, it doesn’t always meet the support, security, or platform requirements of large organizations.
This is why organizations choose ActiveState Python for their data science, big data processing and statistical analysis needs.
Pre-bundled with the most important packages Data Scientists need, ActiveState Python is pre-compiled so you and your team don’t have to waste time configuring the open source distribution. You can focus on what’s important–spending more time building algorithms and predictive models against your big data sources, and less time on system configuration.
ActiveState Python is 100% compatible with the open source Python distribution, and provides the security and commercial support that your organization requires.
With ActiveState Python you can explore and manipulate data, run statistical analysis, and deliver visualizations to share insights with your business users and executives sooner–no matter where your data lives.
Some Popular Python Packages You Get Pre-compiled – with ActiveState Python for Data Science/Big Data/Machine Learning
- pandas (data analysis)
- NumPy (multi-dimensional arrays)
- SciPy (algorithms to use with numpy)
- HDF5 (store & manipulate data)
- Matplotlib (data visualization)
- Jupyter (research collaboration)
- PyTables (managing HDF5 datasets)
- HDFS (C/C++ wrapper for Hadoop)
- pymongo (MongoDB driver)
- SQLAlchemy (Python SQL Toolkit)
- redis (Redis access libraries)
- pyMySQL (MySQL connector)
- scikit-learn (machine learning)
- TensorFlow (deep learning with neural networks)
- scikit-learn (machine learning algorithms)
- keras (high-level neural networks API)
Download ActiveState Python to get started or contact us to learn more about using ActiveState Python in your organization.


