As data volumes continue to expand exponentially in various scientific and industrial sectors, clustering has become an essential big data analysis technique. It helps generate a compact summary of data for classification, supporting a number of use case, including:
- Pattern discovery
- Hypothesis generation and testing
- Compression
- Reduction
- Outlier detection
- Recommendation systems
- Customer segmentation
- Social network analysis
- etc
Among the various clustering algorithms, K-means clustering is one of the most popular and widely used algorithms in big data analysis.
In this post, we will delve into the world of big data and K-means clustering to help readers understand the application of the K-means clustering algorithm in big data using Python.
What Is Data Clustering?
Clustering is a type of unsupervised Machine Learning (ML) technique in which data is partitioned into similar groups (clusters) based on certain characteristics. It follows that clusters, then, are groups of data objects that are more similar to other objects in their cluster than they are to data objects in other clusters.
Clustering reduces the dimensionality of the data set making it simpler to work with.
While there are many clustering algorithms out there, K-means is one of the most popular due to its simplicity and fast convergence. This algorithm aims to classify data points into “K” clusters, where each data point belongs to the nearest cluster mean.
What Is K-Means Clustering and How Does It Work?
K-means clustering is an unsupervised ML algorithm that is ideal for segmenting big data into distinct groups. For example, say you have info on thousands of customers. You could use K-means to cluster them into groups based on attributes like age, location, or buying habits. This would help uncover patterns you might otherwise miss, and can improve the results obtained from a targeted marketing campaign.
The “K” in K-means refers to the number of clusters you want to divide your data into. You determine “K” based on your data and needs. The algorithm then works to find the centers of K clusters in your data (called “centroids”) as follows:
- Choose the number of clusters (K). This is the most critical step and requires domain knowledge about your data.
- Select random K points as cluster centroids. These will be modified in the following steps.
- Assign each data point to the closest cluster centroid. Measure the distance between each point and centroid to determine which cluster is closest.
- Recalculate the cluster centroids by taking the mean of all points in each cluster.
- Repeat steps 3 and 4 until the cluster centroids no longer change. This means the clusters have stabilized.
This results in K clusters with data points that are similar to each other within the same cluster, but different from points in other clusters. Pretty cool, right?
K-means plays a vital role in data mining and is the simplest and most widely used algorithm for clustering in big data. The versatility and scalability of the algorithm make it a popular choice for many data-driven applications, including:
- Customer segmentation: K-means clustering can be used to segment customers based on their behavior, preferences, or demographics. This can help businesses personalize their marketing campaigns and improve customer engagement.
- Image and video processing: K-means clustering can be used for image and video processing applications like image compression, object recognition, and video summarization. By clustering similar pixels or frames together, K-means can reduce the size of the data and extract meaningful features.
- Anomaly detection: K-means clustering can be used for anomaly detection in big data. By clustering the normal data points together, K-means can identify data points that deviate significantly from the norm (which may indicate anomalies or outliers).
- Recommendation systems: K-means clustering can be used to build recommendation systems that suggest products or services to users based on their preferences or behavior. By clustering similar users or items together, K-means can identify patterns and make personalized recommendations.
- Bioinformatics: K-means clustering can be used in bioinformatics applications like gene expression analysis, protein structure prediction, and drug discovery. By clustering similar genes or proteins together, K-means can identify patterns and relationships that may be useful for scientific research.
How to Implement K-Means Clustering Using Python
In this section, we will demonstrate how to leverage the K-means algorithm and Python to recommend movies given a set of keywords using the TMD Movie Dataset from Kaggle and the Kaggle Jupyter playground. You can find the complete code here. Here’s the process we’ll follow:
- Install the prebuilt K-Means Clustering runtime environment
- Import the key libraries we’ll need
- Load the datasets and prepare the data
- Train the model
- Test the model
- Evaluate the model
Step 1 – Install a Prebuilt K-means Clustering Runtime
Before getting started, you’ll need to install our prebuilt K-Means Clustering runtime environment, which includes:
- Numpy – used for array operations
- Pandas – used to load the CSV datasets
- Matplotlib – used for data visualization
- Scikit-learn – we’ll be using the K-means model from the scikit-learn library

In order to download this ready-to-use Python project, you will need to create a free ActiveState Platform account. Just use your GitHub credentials or your email address to register. Signing up is easy and it unlocks the ActiveState Platform’s many other dependency management benefits.
Windows users can install the K-Means Clustering runtime into a virtual environment by downloading and double-clicking on the installer. You can then activate the project by running the following command at a Command Prompt:
state activate --default Pizza-Team/K-Means_Clustering
For Mac and Linux users, run the following to automatically download, install and activate the K-Means Clustering runtime in a virtual environment:
sh <(curl -q https://platform.www.activestate.com/dl/cli/_pdli01/install.sh) -c'state activate --default Pizza-Team/K-Means-Clustering'
Step 2 – Import Libraries
To get started, you’ll need to import a few key libraries:
					```python

import numpy as np # linear algebra

import pandas as pd # data processing, CSV file I/O (e.g. pd.read_csv)

from sklearn.feature_extraction.text import TfidfVectorizer

from sklearn.cluster import KMeans

import matplotlib.pyplot as plt

```
Step 3 – Load Datasets and Prepare Data
Next, we’ll use the directory file path provided by Kaggle to load the movies and credits datasets:
					# Loading the dataset

movies_df = pd.read_csv('/kaggle/input/tmdb-movie-metadata/tmdb_5000_movies.csv')

credits_df = pd.read_csv('/kaggle/input/tmdb-movie-metadata/tmdb_5000_credits.csv')
After loading, you may want to peek at the top 5 rows of the datasets:
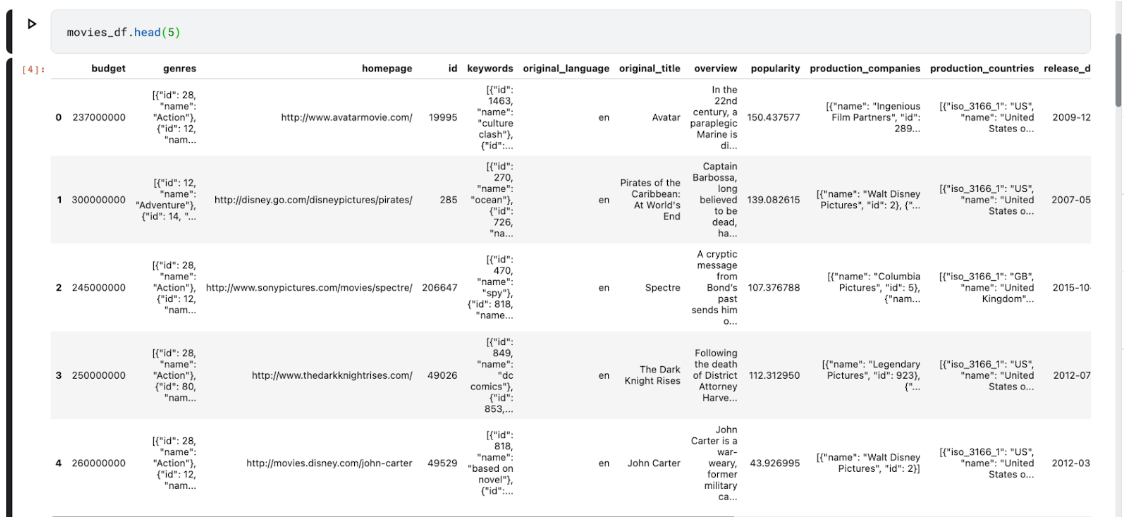
The top 5 rows of the credits dataset look like this:

Now, we’ll merge the datasets to get a complete view of the movies dataframe:
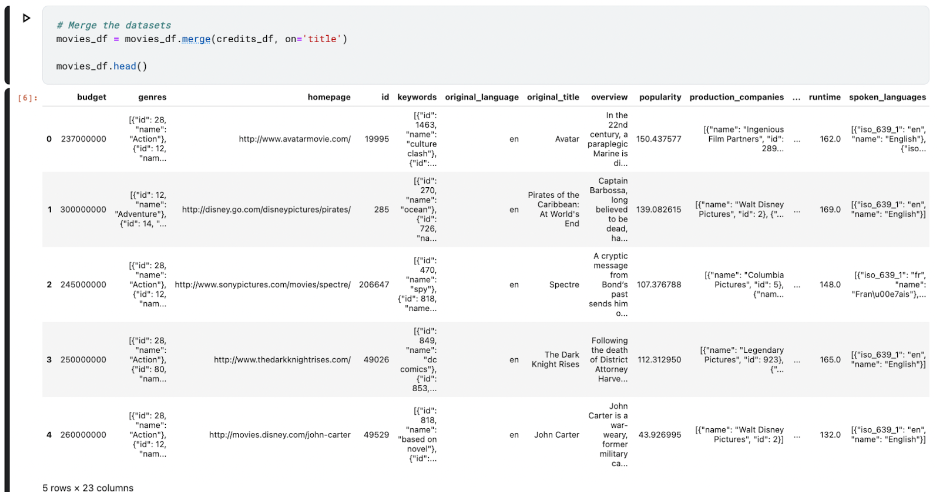
Next, we’ll want to preprocess the merged dataset and prepare it for model training:
					# Preprocess the data

movies_df['overview'].fillna('', inplace=True)

movies_df['keywords'] = movies_df['keywords'].apply(lambda x: [i['name'] for i in eval(x)])
You can vectorize the data for the K-means algorithm as follows:
					# Vectorize the text

vectorizer = TfidfVectorizer(stop_words='english')

X = vectorizer.fit_transform(movies_df['overview'])
Step 4 – Train the Movie Recommendation Model Using K-Means
Now, we’ll train the K-means model on our data. We’ll set the number of clusters to 3 since we want to group the different genres into 10 and randomize them by 42. Here’s why:
- We chose 3 clusters because we believe that this is the minimum number required to capture all of the variations in our data.
- We chose 10 genres because that’s the most common number utilized in movie recommendation systems. This allows us to deliver more detailed recommendations to users while keeping the number of clusters reasonable.
- We chose the number 42 as the random seed because it is a prime number that is neither too small nor overly large. This guarantees that our model is not biased toward any specific set of data.
					# Perform k-means clustering

kmeans = KMeans(n_clusters=10, random_state=42)

kmeans.fit(X)
Next, we’ll create a Python function that takes in a set of keywords, and then uses the K-means model above to predict movies based on the given keywords:
					```

def recommend_movies(keywords):

    input_vector = vectorizer.transform([keywords]) # Vectorize and Transform the user's input for the keywords


    cluster = kmeans.predict(input_vector)[0] # Predict the cluster for the input

    cluster_movies = movies_df[kmeans.labels_ == cluster] # Get movies from the same cluster


    recommendations = cluster_movies.sort_values('popularity', ascending=False)[:10]  # Sort movies by popularity

    return recommendations #return the top 10 recommendations

```
Step #5 – Test the Model and Get Movie Recommendations
Now that we’ve laid the foundation for the movie recommendations, we can statically define a set of keywords (in this case, based on sci-fi movies):
					```

 import matplotlib.pyplot as plt


    plt.scatter(recommendations['popularity'], recommendations['vote_average'])

    plt.xlabel('Popularity')

    plt.ylabel('Vote Average')

    plt.title(f"Recommendations for keyword: {keyword}")

    plt.show()

```
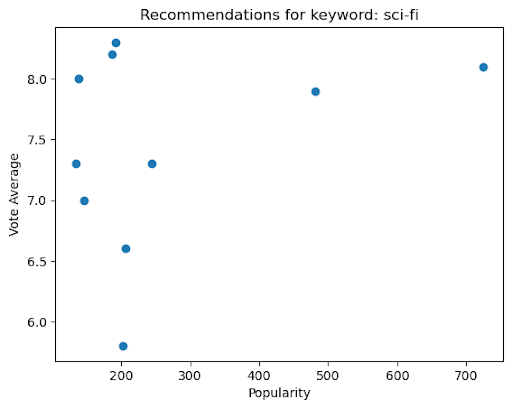
Using the same criteria, we can also graph how the popularity and votes for the sci-fi genre play out using a bar graph:
					 import matplotlib.pyplot as plt

    # Create a bar chart of movie titles and popularity

    plt.bar(recommendations['title'], recommendations['popularity'])

    plt.xlabel('Movie Title')

    plt.ylabel('Popularity')

    plt.title(f"Recommendations for keyword: {keyword}")

    plt.xticks(rotation=90)

    plt.show()
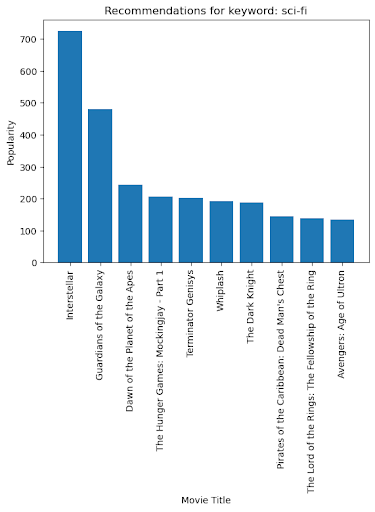
Step #6 – Evaluate the Model
We can evaluate the K-means model using the inertia_ attribute, which is the sum of squared distances of samples to their closest cluster center:
					```

print(kmeans.inertia_)

```
The inertia of the K-means model is 4725.754891968412. This is a relatively low value, which indicates that the model is a good fit.
However, it’s important to note that the inertia of a K-means model is not the only factor to consider when evaluating model fit. Other factors such as the number of clusters and the distribution of data points can also affect the inertia.
Conclusions – K-means Clustering Limitations
Although K-means is a popular and powerful unsupervised machine learning clustering algorithm, it has some shortcomings that can limit its effectiveness in some applications. In our movie recommendation program above, for example, the following weaknesses may manifest:
- If the number of clusters is not specified correctly, the system may not be able to capture the different types of movies that users are interested in.
- If the initial values of the centroids are not chosen carefully, the system may end up clustering movies that are not actually similar together.
- If there are outliers in the data, the system may assign them to the wrong cluster, which could lead to inaccurate recommendations.
To improve our movie recommendation system, we could use a range of other clustering algorithms that address the potential weaknesses of K-means. The unique qualities of the data will define the appropriate clustering algorithm for a specific application. For example, hierarchical clustering can be used to locate clusters of varied sizes and forms, which is useful for data that is not properly separated into distinct clusters. Density-based clustering and Gaussian mixture models are two other clustering strategies I’ll leave to the reader to explore.
Next Steps:
Sign up for a free ActiveState Platform account so you can download the K-Means Clustering runtime environment and try it out on your own data.


